Taxonomy system dashboard

Taxonomy system dashboard

Taxonomy system dashboard

Jul 23, 2025

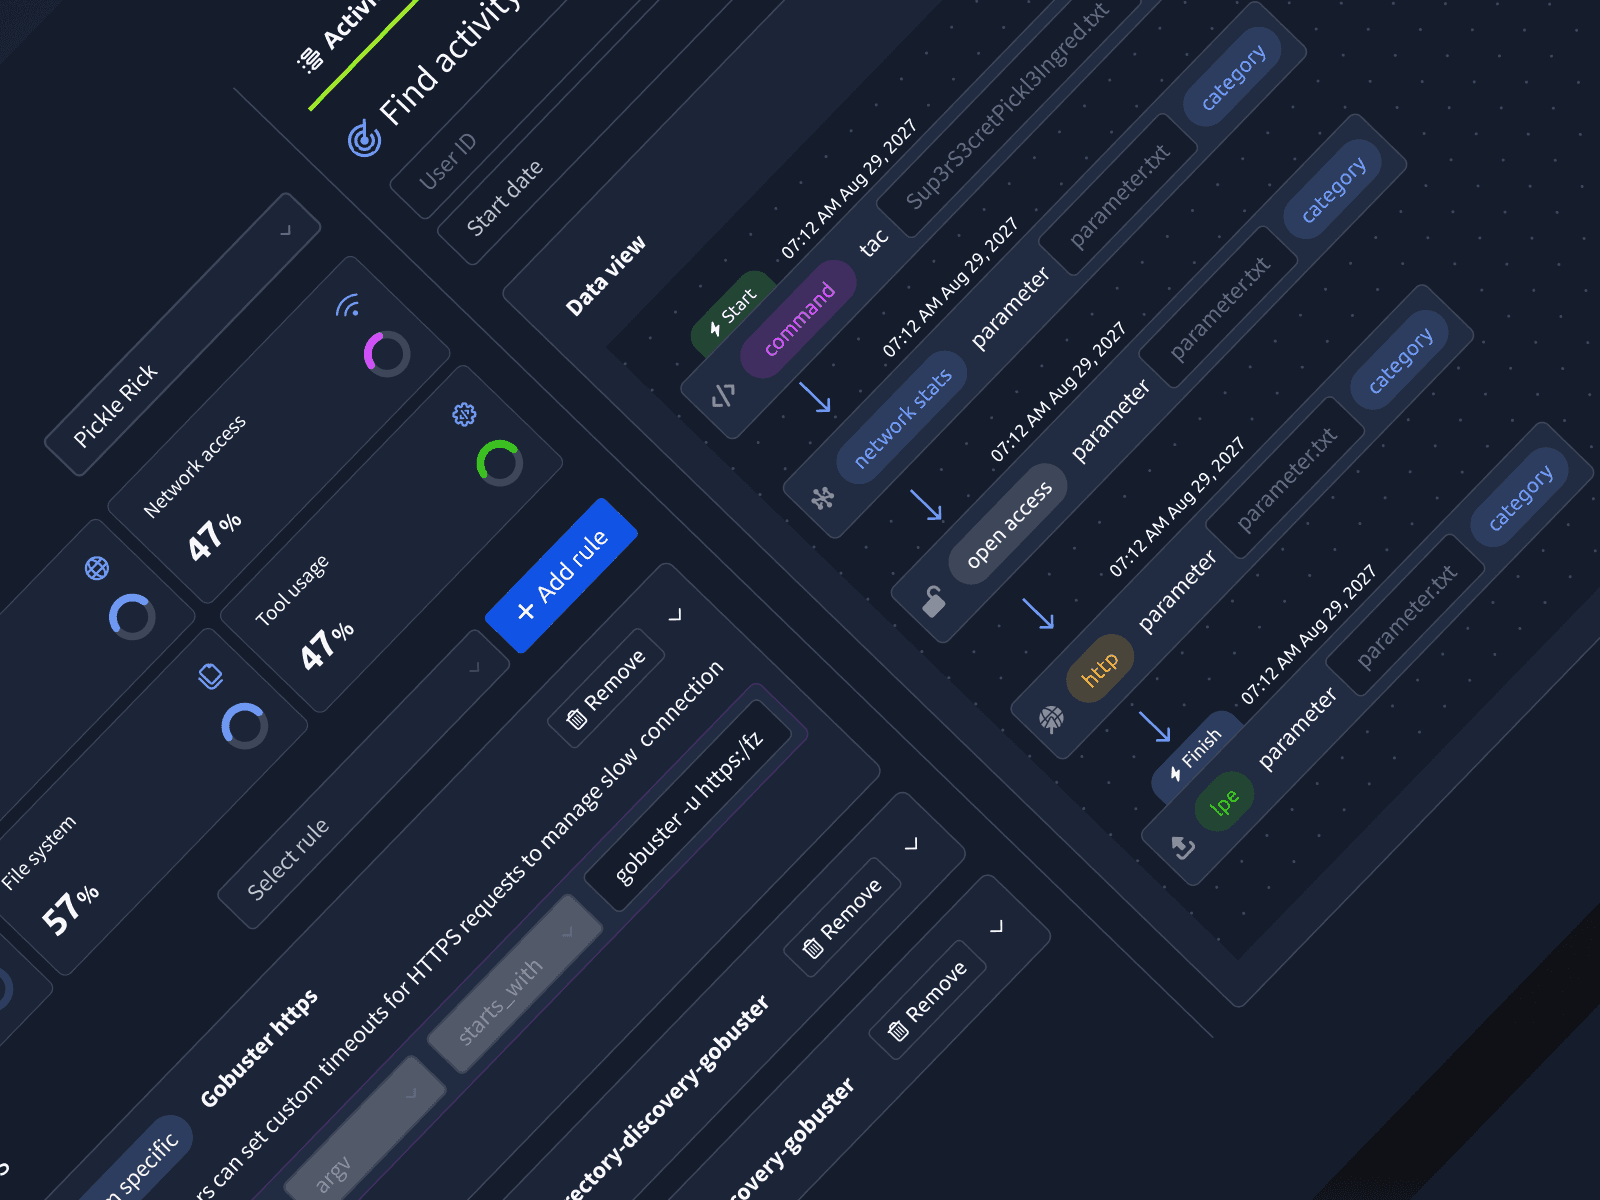
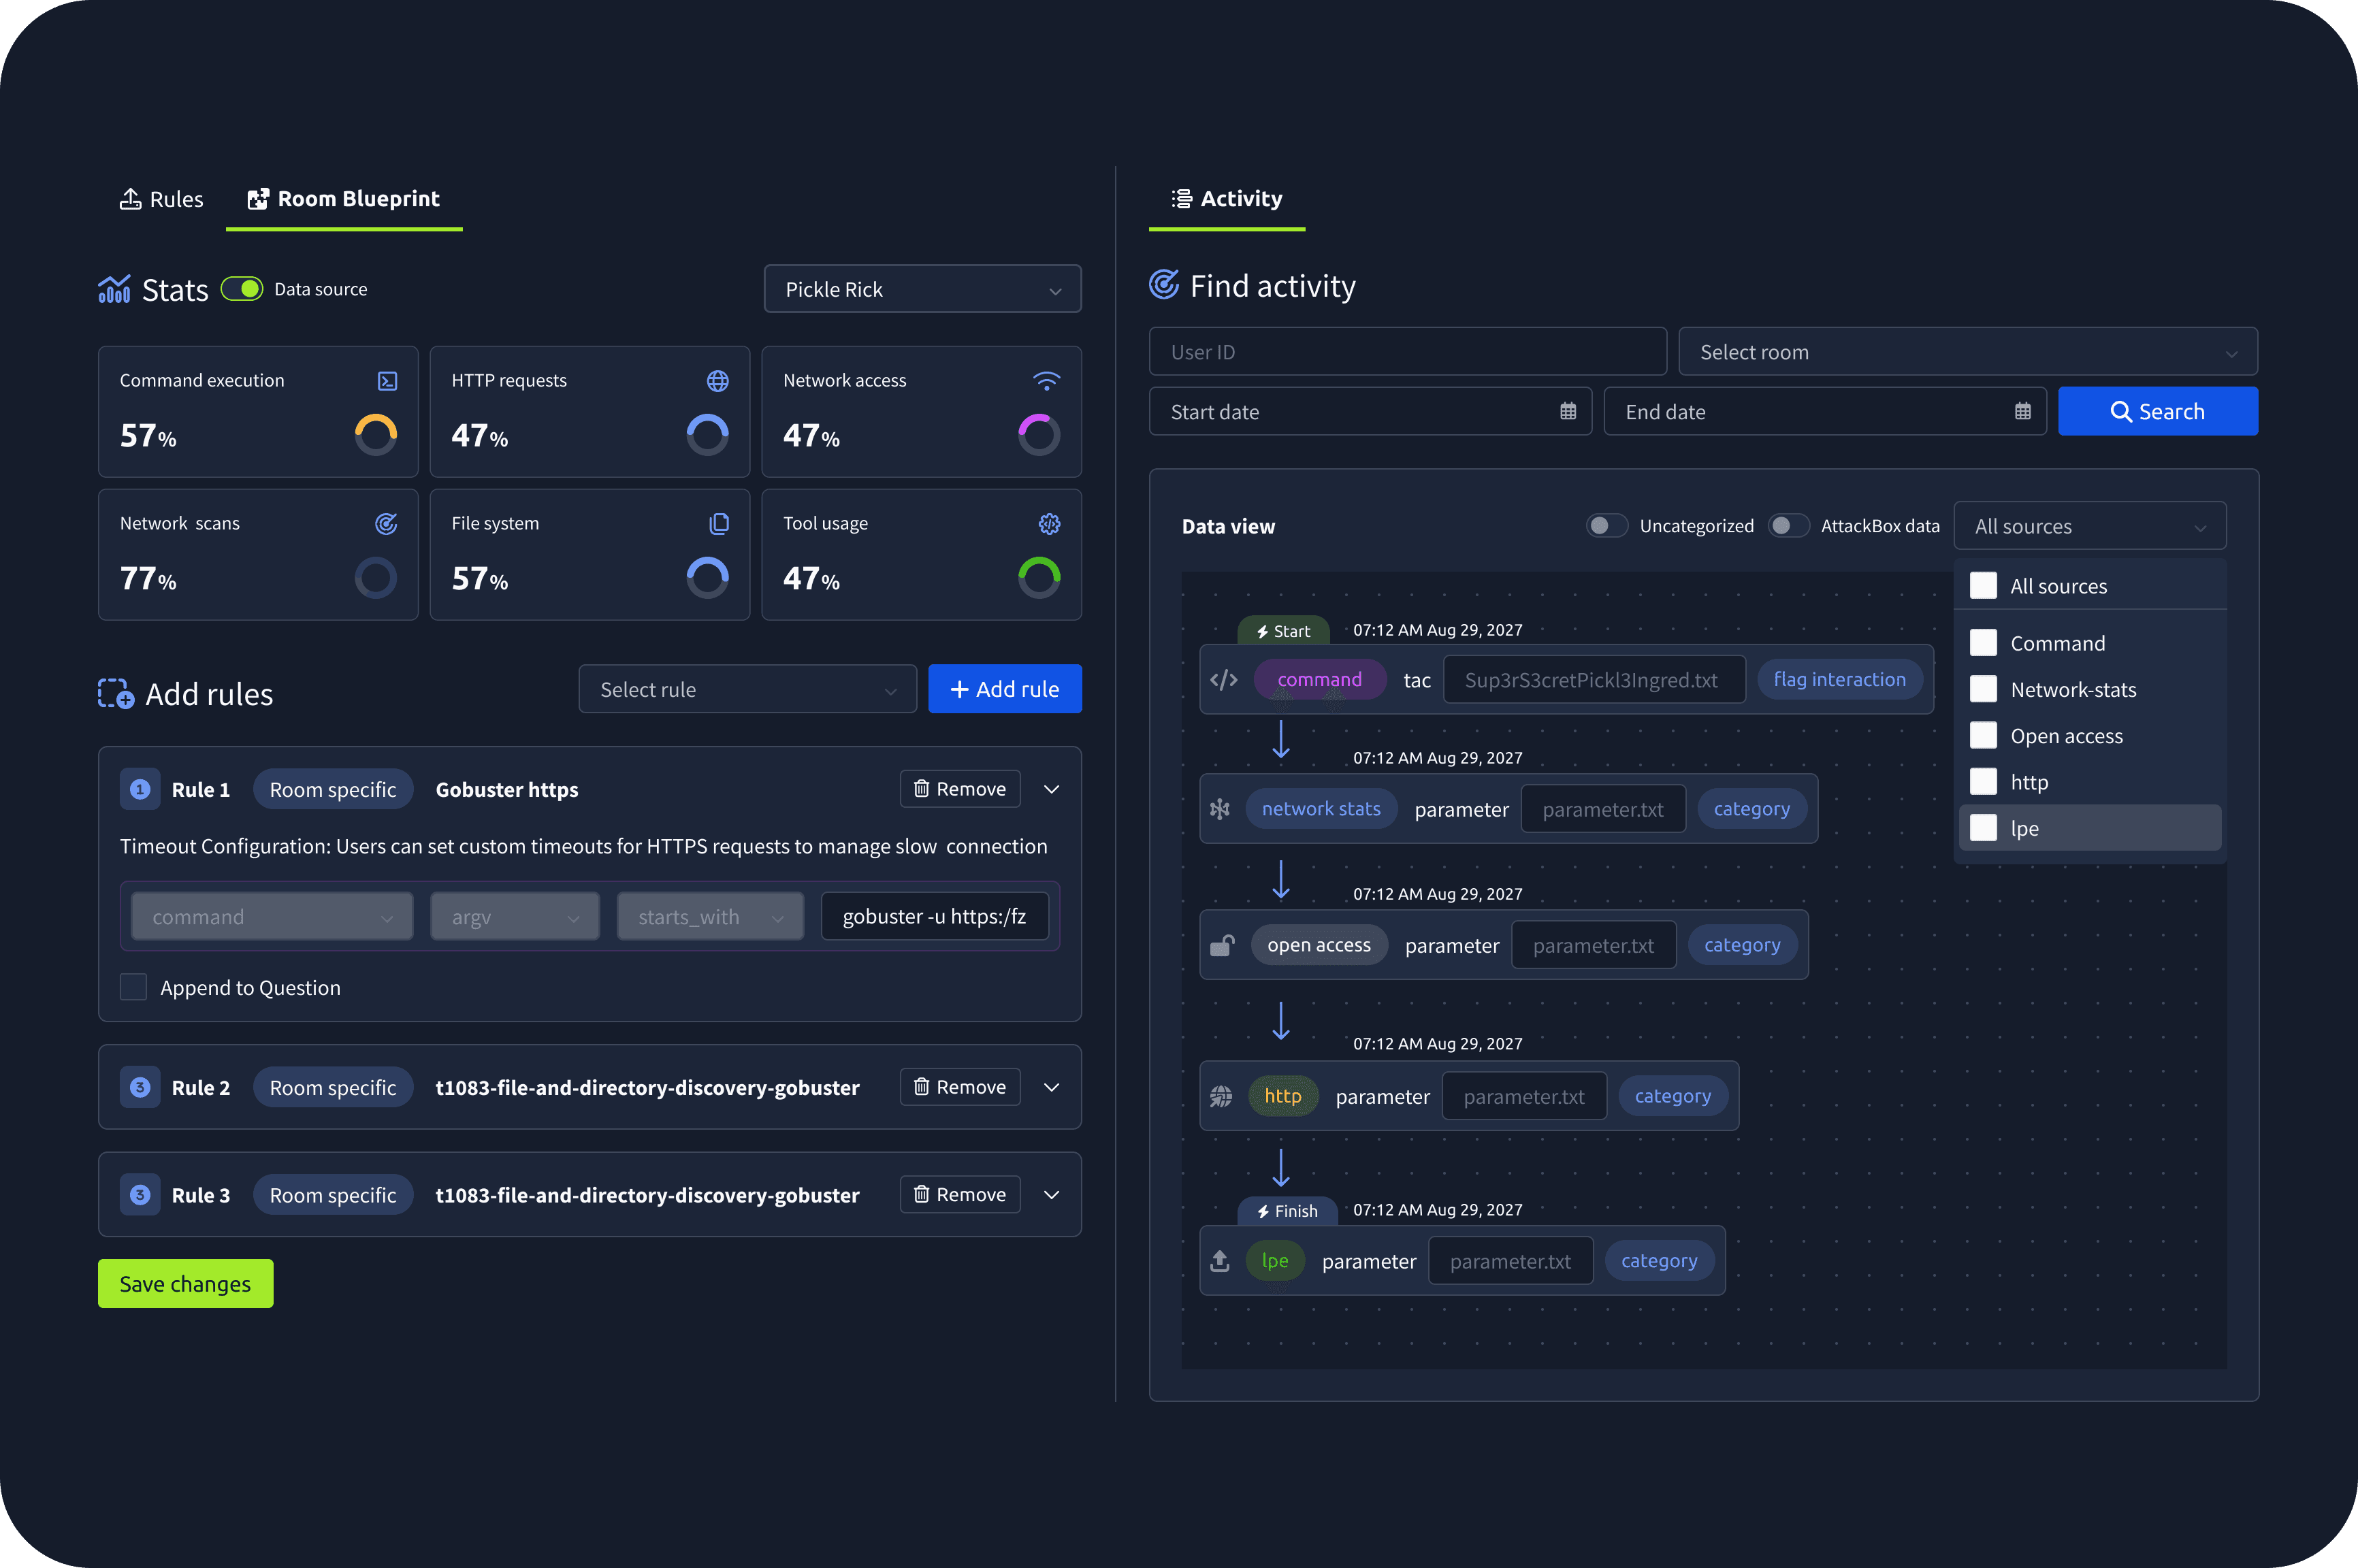
A dashboard designed to help machine learning engineers and content teams define, manage, and refine learning categorisation rules based on real user behavior. The tool translates complex learning paths and usage patterns into a clear, usable interface—making it easier to maintain accurate categorisation at scale and improve how content is surfaced across the platform.

0M+

users reached

0+

months of collaboration

7000+

hours of time saved

The process

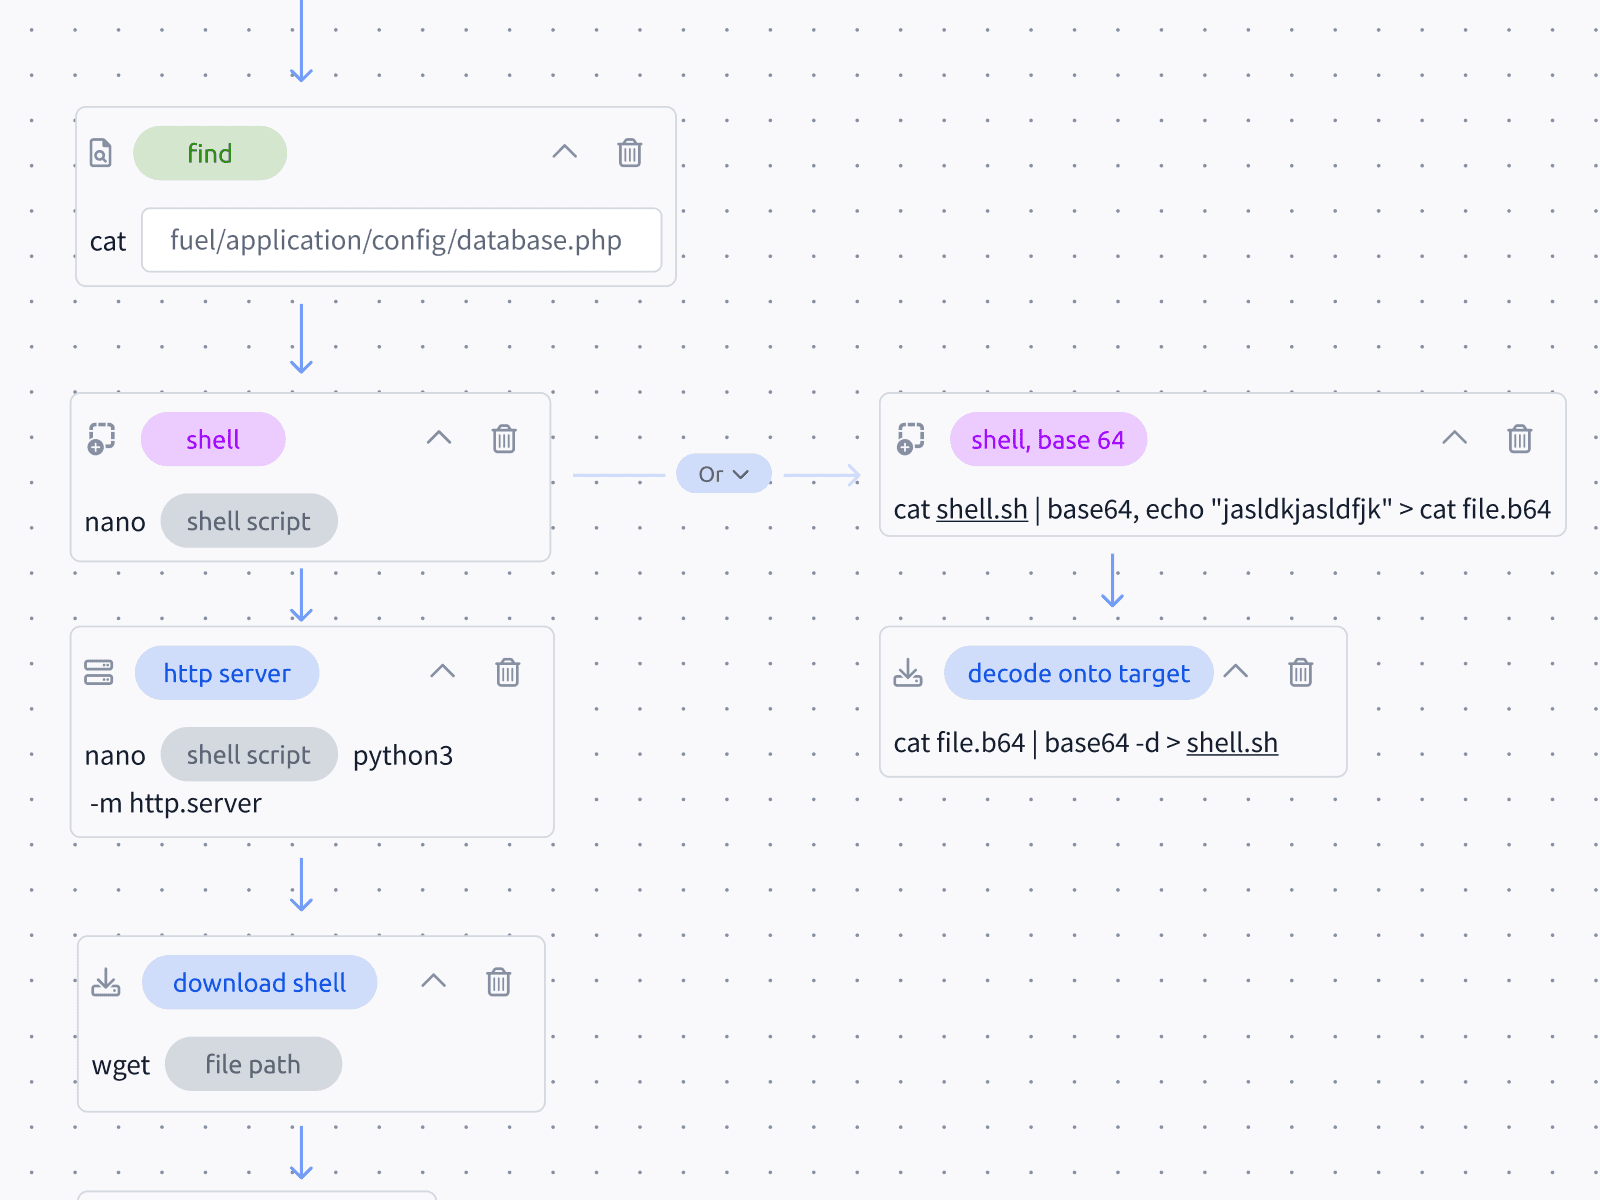
The design process focused on translating complex data and machine learning logic into a calm, usable experience. By grounding decisions in real usage patterns and close collaboration with ML engineers, the dashboard balances flexibility with safety—enabling teams to manage categorisation confidently while supporting long-term scalability.

01

Discovery

/research and insights

We worked closely with ML engineers to understand how learning data was generated, how categorisation rules were created, and where existing workflows broke down. Analysis of common learning paths revealed gaps between raw data and actionable insights.

01

Discovery

/research and insights

We worked closely with ML engineers to understand how learning data was generated, how categorisation rules were created, and where existing workflows broke down. Analysis of common learning paths revealed gaps between raw data and actionable insights.

01

Discovery

/research and insights

We worked closely with ML engineers to understand how learning data was generated, how categorisation rules were created, and where existing workflows broke down. Analysis of common learning paths revealed gaps between raw data and actionable insights.

02

Design

/concepts and execution

The dashboard was designed to surface patterns clearly while giving engineers precise control over categorisation logic. The focus was on reducing cognitive load, making rules easy to inspect and edit, and clearly showing how changes would affect learning pathways.

03

Testing & Iteration

/feedback and refinement

Designs were iterated using real datasets and edge cases to ensure the interface supported both quick updates and more complex rule creation. Feedback from ML engineers helped refine terminology, hierarchy, and interaction patterns.

03

Testing & Iteration

/feedback and refinement

Designs were iterated using real datasets and edge cases to ensure the interface supported both quick updates and more complex rule creation. Feedback from ML engineers helped refine terminology, hierarchy, and interaction patterns.

03

Testing & Iteration

/feedback and refinement

Designs were iterated using real datasets and edge cases to ensure the interface supported both quick updates and more complex rule creation. Feedback from ML engineers helped refine terminology, hierarchy, and interaction patterns.

04

Delivery

/handoff and launch

The final dashboard was delivered as a scalable internal tool, aligned with existing data pipelines and engineering workflows. Clear states, validation, and feedback ensured changes could be made confidently without unintended consequences.

04

Delivery

/handoff and launch

The final dashboard was delivered as a scalable internal tool, aligned with existing data pipelines and engineering workflows. Clear states, validation, and feedback ensured changes could be made confidently without unintended consequences.

04

Delivery

/handoff and launch

The final dashboard was delivered as a scalable internal tool, aligned with existing data pipelines and engineering workflows. Clear states, validation, and feedback ensured changes could be made confidently without unintended consequences.

05

Scaling

/growth optimization

The system was designed to evolve as new learning content, categories, and behavioral patterns emerged. Its modular structure allows categorisation logic to scale alongside the platform without increasing complexity.

05

Scaling

/growth optimization

The system was designed to evolve as new learning content, categories, and behavioral patterns emerged. Its modular structure allows categorisation logic to scale alongside the platform without increasing complexity.

05

Scaling

/growth optimization

The system was designed to evolve as new learning content, categories, and behavioral patterns emerged. Its modular structure allows categorisation logic to scale alongside the platform without increasing complexity.

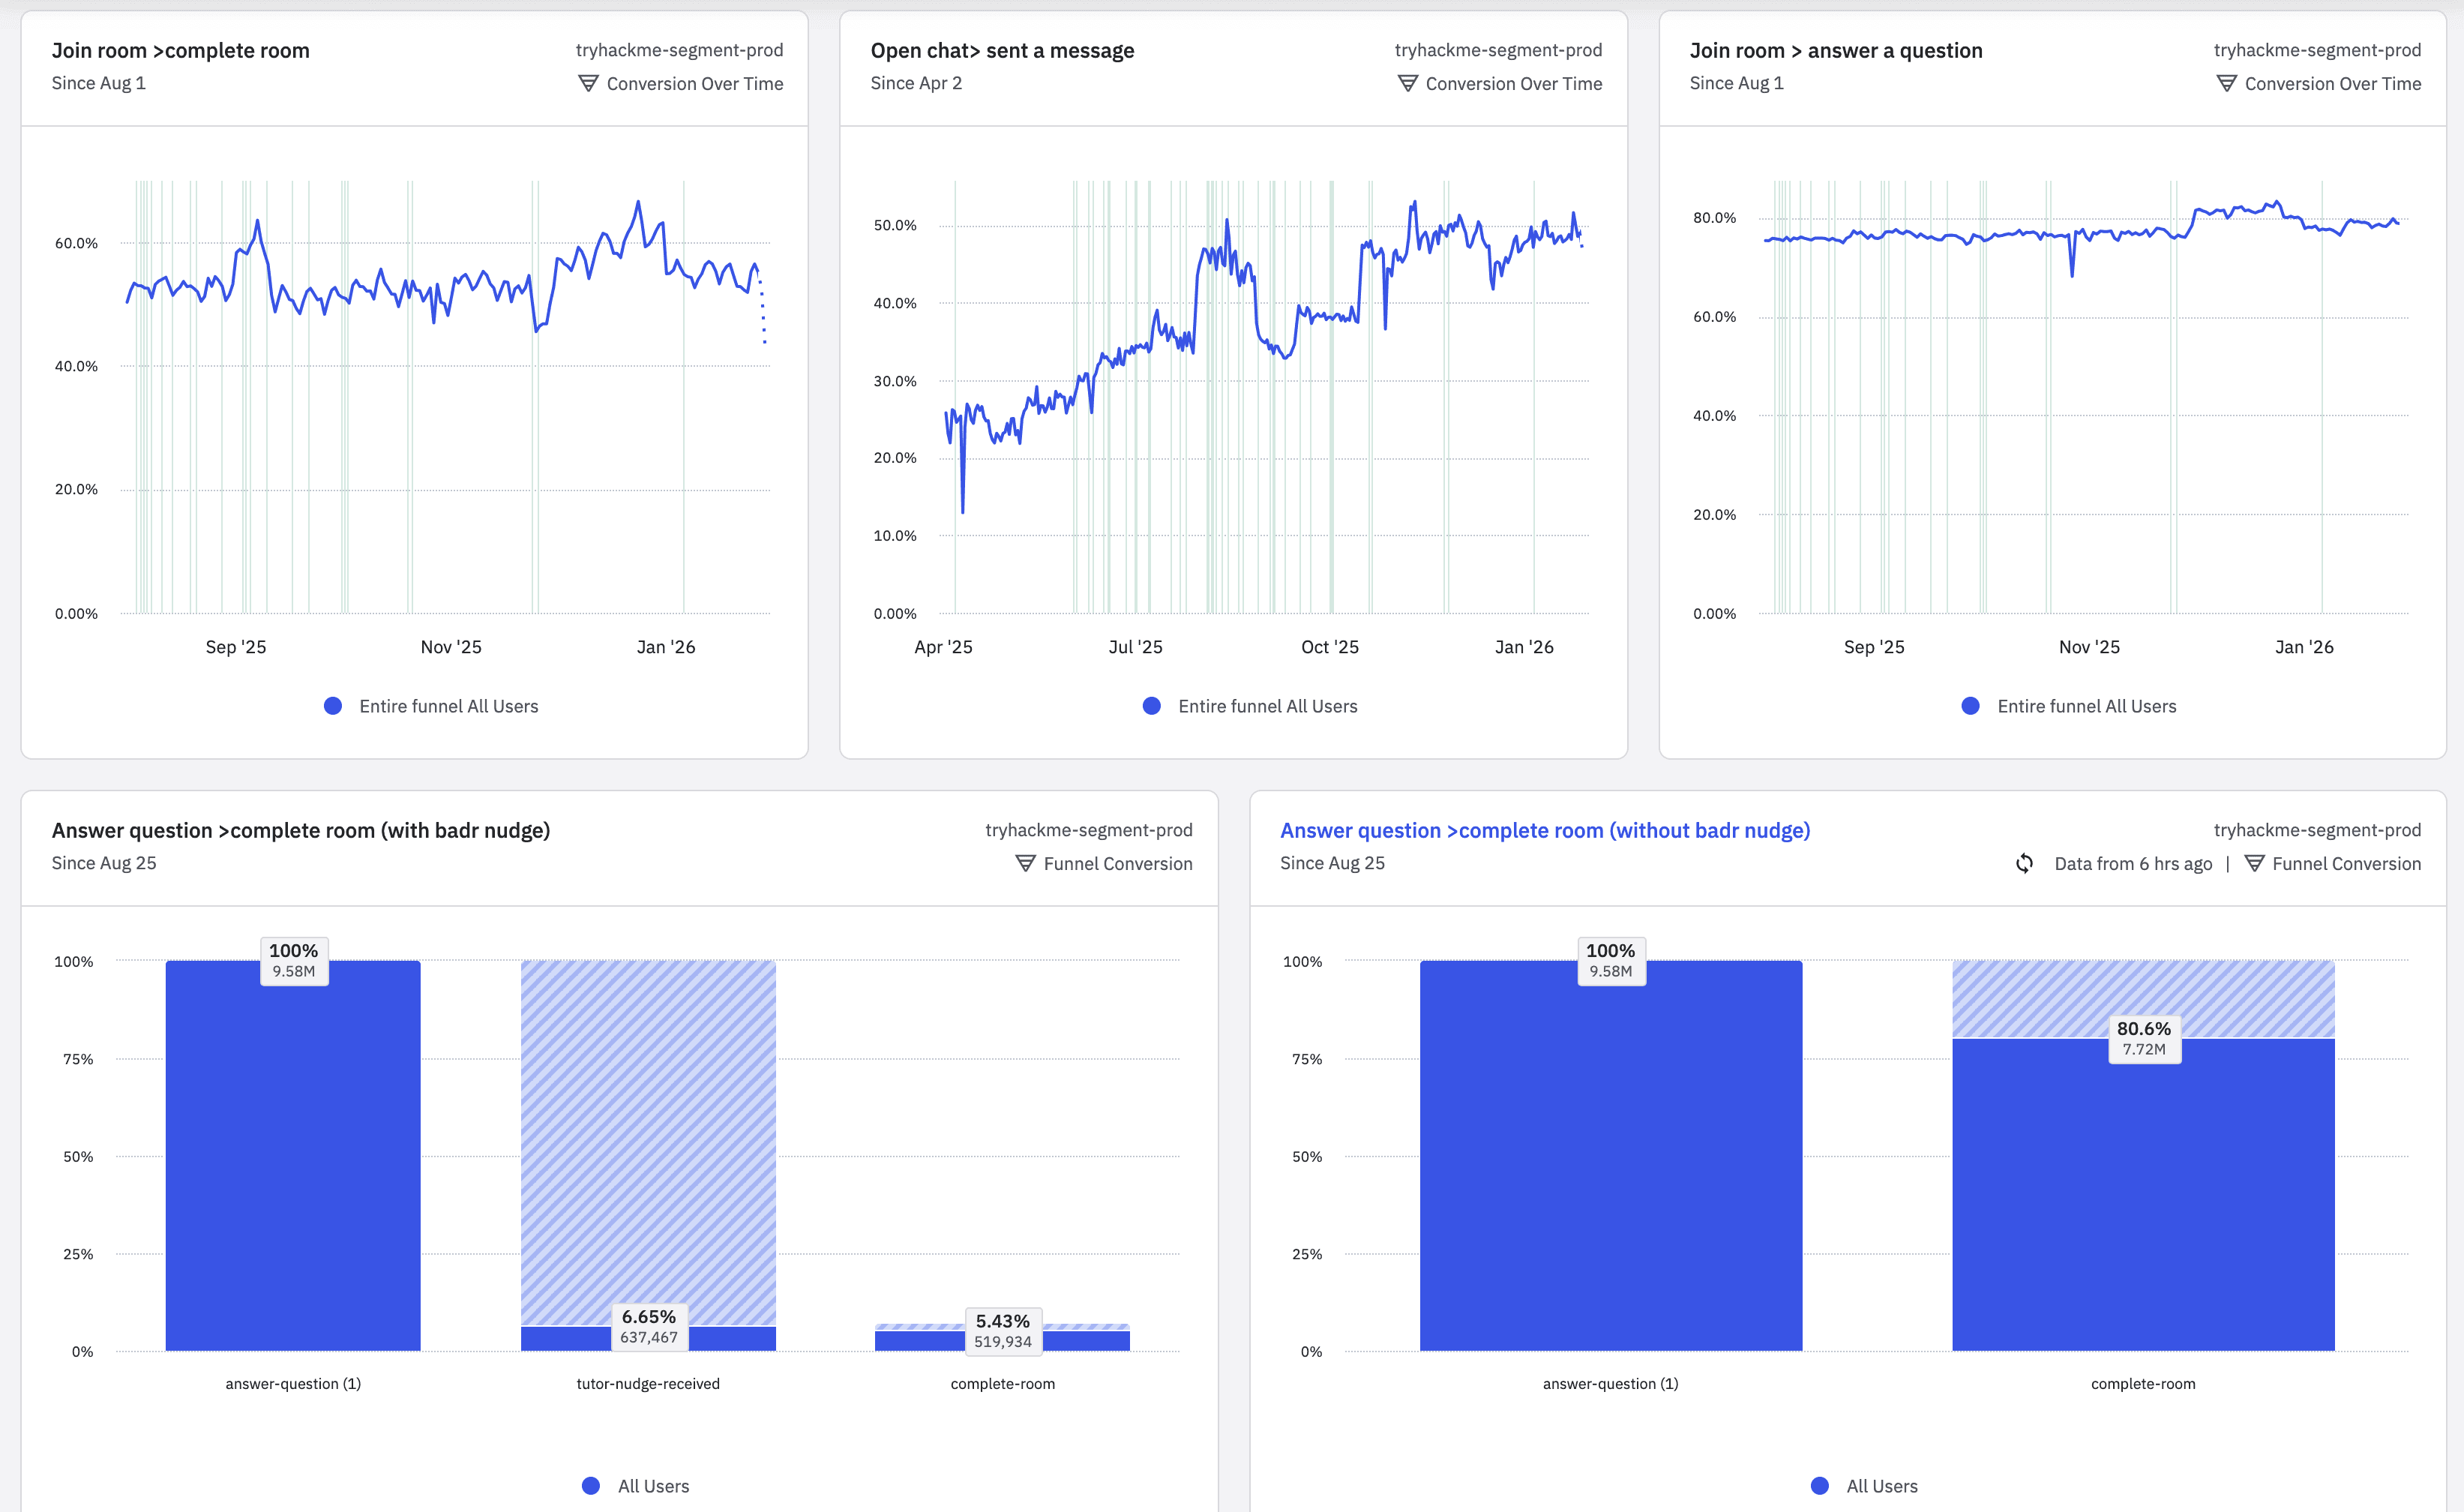
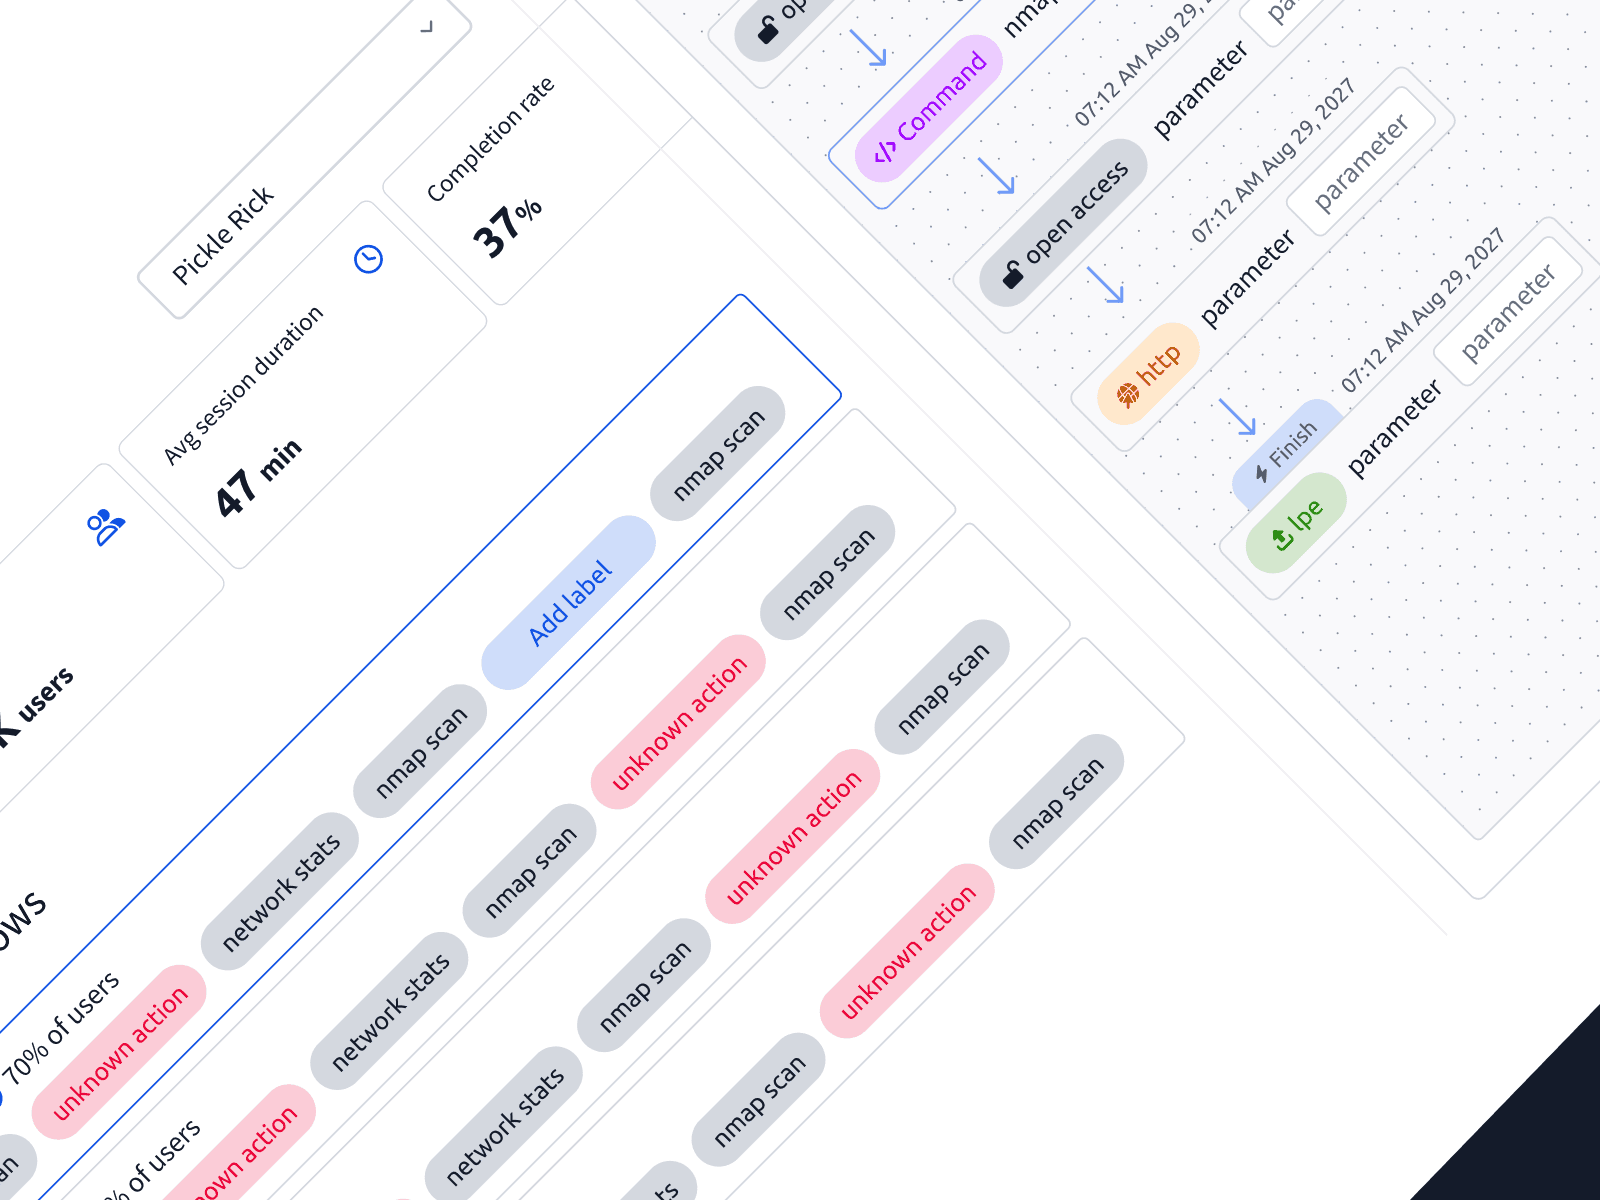
Performance at scale

Satisfaction

Score

87%
37+

Countries

37+

Countries

37+

Countries

0K+

Views

0K+

Views

0K+

Views

0+

Languages

0+

Languages

0+

Languages

17M+

Active users

2021

2022

2023

2024

2025